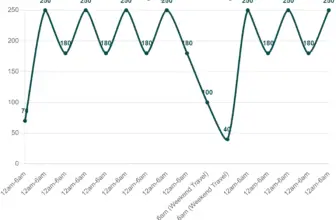
Enphase IQ 50 EV Charger Speed of Charge

The chart illustrates the primary considerations for selecting public EV charging stations. Notably, charging speed ranks highest, with 42% of respondents prioritizing swift charging times. Following ...
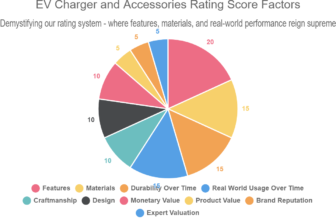
Our EV charger ratings go beyond just power output. We dissect each product on a 100-point scale, with key factors like features (20%), material (15%), and durability (15%) heavily weighted. We test ...

The pie chart illustrates the distribution of electric vehicle (EV) charging levels and their corresponding percentages. Level 2 (240V) charging dominates the chart, representing 79.5% of the total. ...
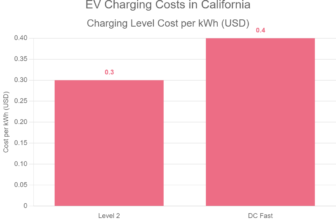
In California, Level 2 charging costs around 30 cents per kWh, while DC fast charging is notably pricier at approximately 40 cents per kWh. Charging a Nissan Leaf with a 149-mile range and efficiency ...
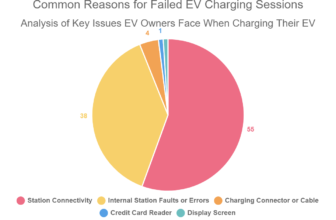
The following pie chart illustrates the primary reasons for failed EV charging sessions based on recent data analysis. From connectivity issues to internal station faults, understanding these factors ...
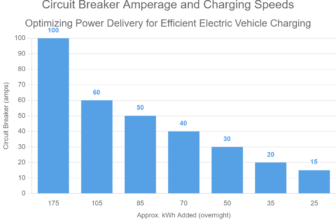
This chart illustrates the relationship between circuit breaker amperage and the performance of Electric Vehicle (EV) chargers. Matching the power ratings of your EV charger with the appropriate ...
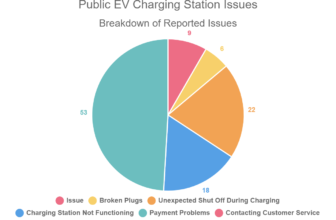
This pie chart illustrates Public EV Charging Station Issues encountered by electric vehicle users based on reported issues. The data reveals that the most prevalent problem is the need to contact ...
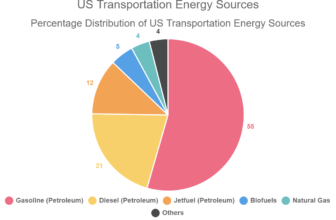
The pie chart illustrates the distribution of energy sources in the United States for transportation. Gasoline derived from petroleum dominates the landscape, constituting the majority at 55%. ...
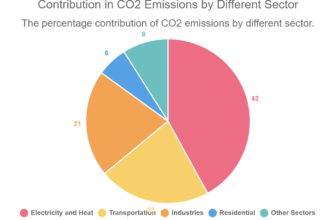
This pie chart illustrates the distribution of CO2 emissions across different sectors: The Electricity and Heat sector is the largest contributor, accounting for 42% of CO2 emissions, followed by ...