
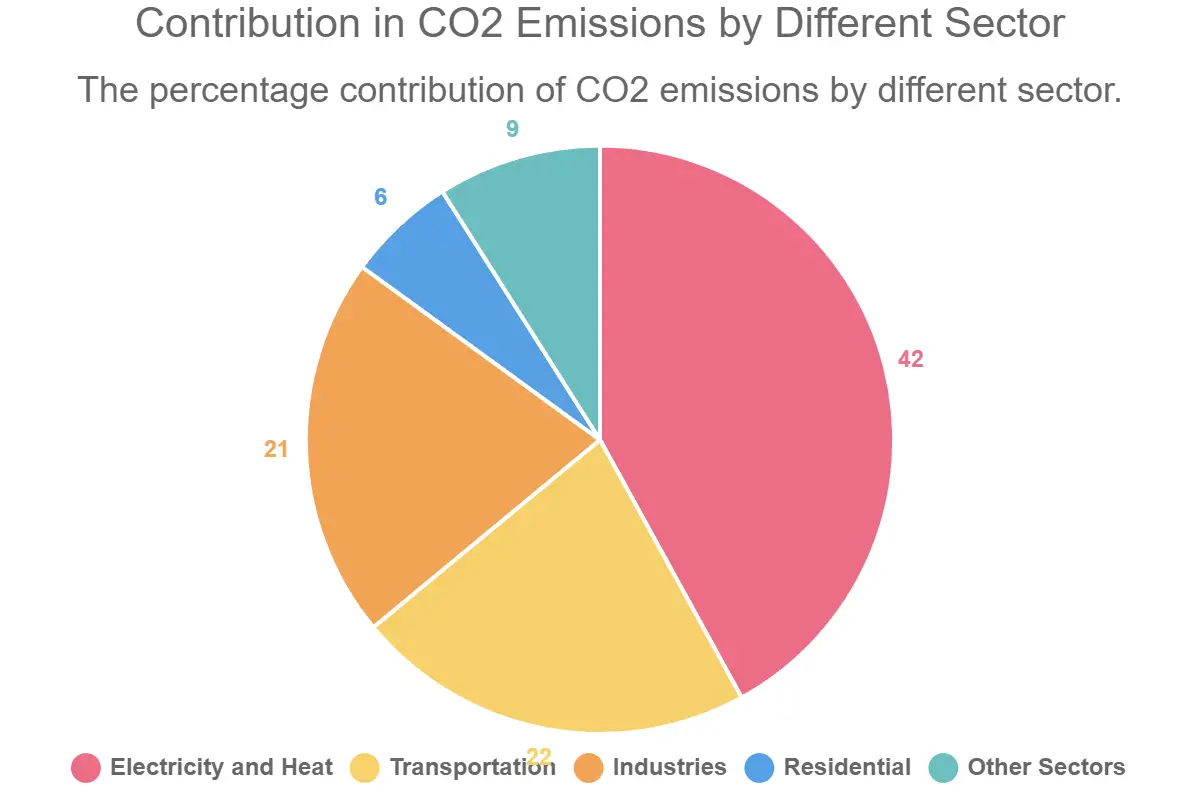
This pie chart illustrates the distribution of CO2 emissions across different sectors: The Electricity and Heat sector is the largest contributor, accounting for 42% of CO2 emissions, followed by Transportation and Industries at 22% and 21%, respectively. Residential activities contribute a smaller share at 6%, and Other Sectors collectively contribute 9% to the overall CO2 emissions.
| Electricity and Heat | 42% |
|---|---|
| Transportation | 22% |
| Industries | 21% |
| Residential | 6% |
| Other Sectors | 9% |