
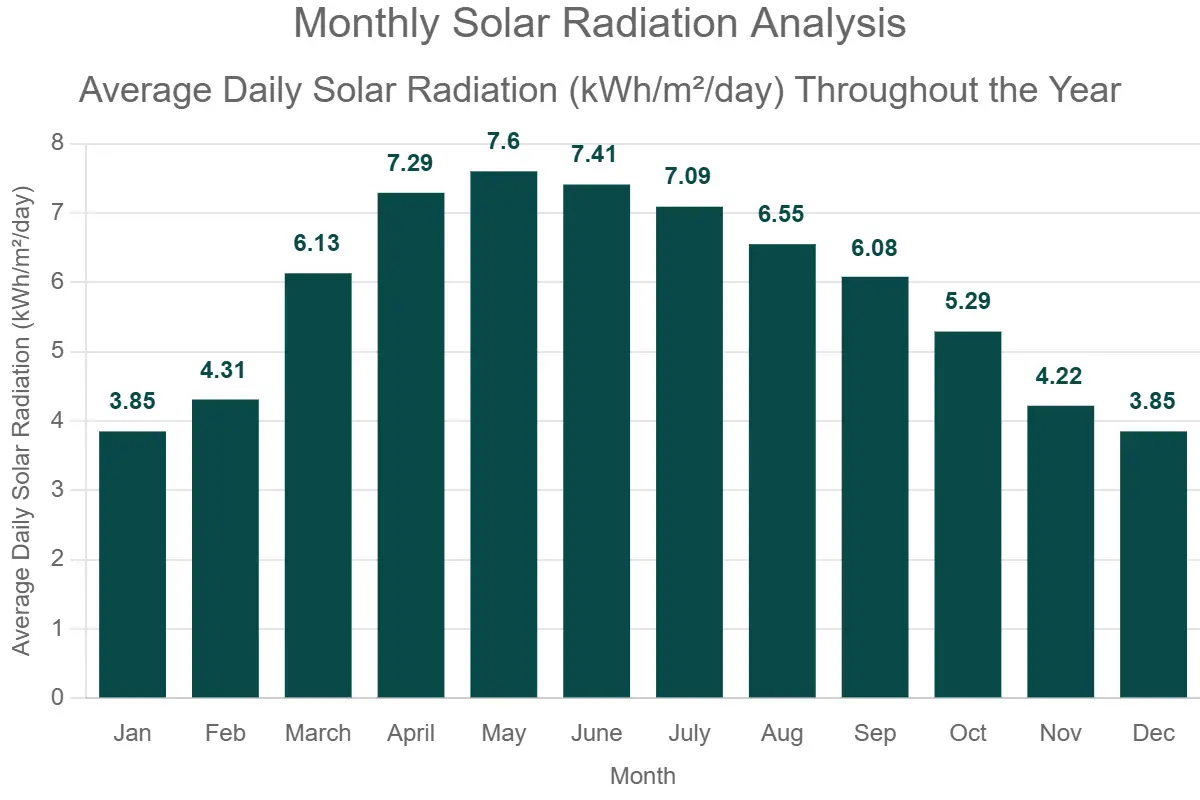
This bar chart illustrates the average daily solar radiation received per square meter each month, measured in kilowatt-hours per square meter per day (kWh/m²/day). The data demonstrates seasonal variations in solar energy availability, peaking in May at 7.6 kWh/m²/day and reaching its lowest levels in January and December at 3.85 kWh/m²/day. Such insights are crucial for optimizing solar panel performance and system design based on seasonal energy yield patterns.
| Jan | Feb | March | April | May | June | July | Aug | Sep | Oct | Nov | Dec |
|---|---|---|---|---|---|---|---|---|---|---|---|
| 3.85 | 4.31 | 6.13 | 7.29 | 7.6 | 7.41 | 7.09 | 6.55 | 6.08 | 5.29 | 4.22 | 3.85 |